Plot Blade Cross-Sections in 3D#
Problem Description#
A blade is described by a layout CSV listing (spanwise_location, section_name)
pairs, with each section stored as a Gmsh mesh (.msh). We want a static 3D
view of all section meshes positioned along the span.
Solution#
First, run.py uses sgio.merge_sections_from_csv() to create
blade_merged.msh. Then run_plot_3d.py reads the merged mesh and renders it
off-screen with PyVista.
import logging
import sgio

logging.basicConfig(level=logging.INFO)

sgio.merge_sections_from_csv(
    csv_file="blade.csv",
    section_dir="cs",
    input_format="gmsh",
    output_file="blade_merged.msh",
    output_format="gmsh22",
)
"""Render merged blade cross-sections to a PNG image with PyVista.

Run ``run.py`` first to merge the section meshes into ``blade_merged.msh``.
This script reads that mesh and creates an off-screen PyVista screenshot.
"""
from __future__ import annotations

from pathlib import Path

import meshio
import pyvista as pv


EXAMPLE_DIR = Path(__file__).resolve().parent
INPUT_FILE = EXAMPLE_DIR / "blade_merged.msh"
OUTPUT_PNG = EXAMPLE_DIR / "blade_3d.png"


def main() -> None:
    """Read the merged mesh and save a PyVista PNG screenshot."""
    mesh = meshio.read(INPUT_FILE)
    grid = pv.from_meshio(mesh)
    grid.clear_data()
    surface = grid.extract_surface(algorithm="dataset_surface")
    boundaries = surface.extract_feature_edges(
        boundary_edges=True,
        feature_edges=False,
        manifold_edges=False,
        non_manifold_edges=False,
    )

    plotter = pv.Plotter(off_screen=True, window_size=(1600, 900))
    plotter.set_background("#f2f4f7")
    plotter.add_mesh(
        surface,
        show_edges=False,
        color="#4c78a8",
        opacity=0.45,
        lighting=False,
    )
    plotter.add_mesh(boundaries, color="#17365d", line_width=3)
    plotter.add_axes()
    plotter.view_isometric()
    plotter.camera.zoom(1.5)
    plotter.show(screenshot=str(OUTPUT_PNG), auto_close=False)
    plotter.close()
    print(f"Wrote PyVista screenshot: {OUTPUT_PNG}")


if __name__ == "__main__":
    main()
Result#
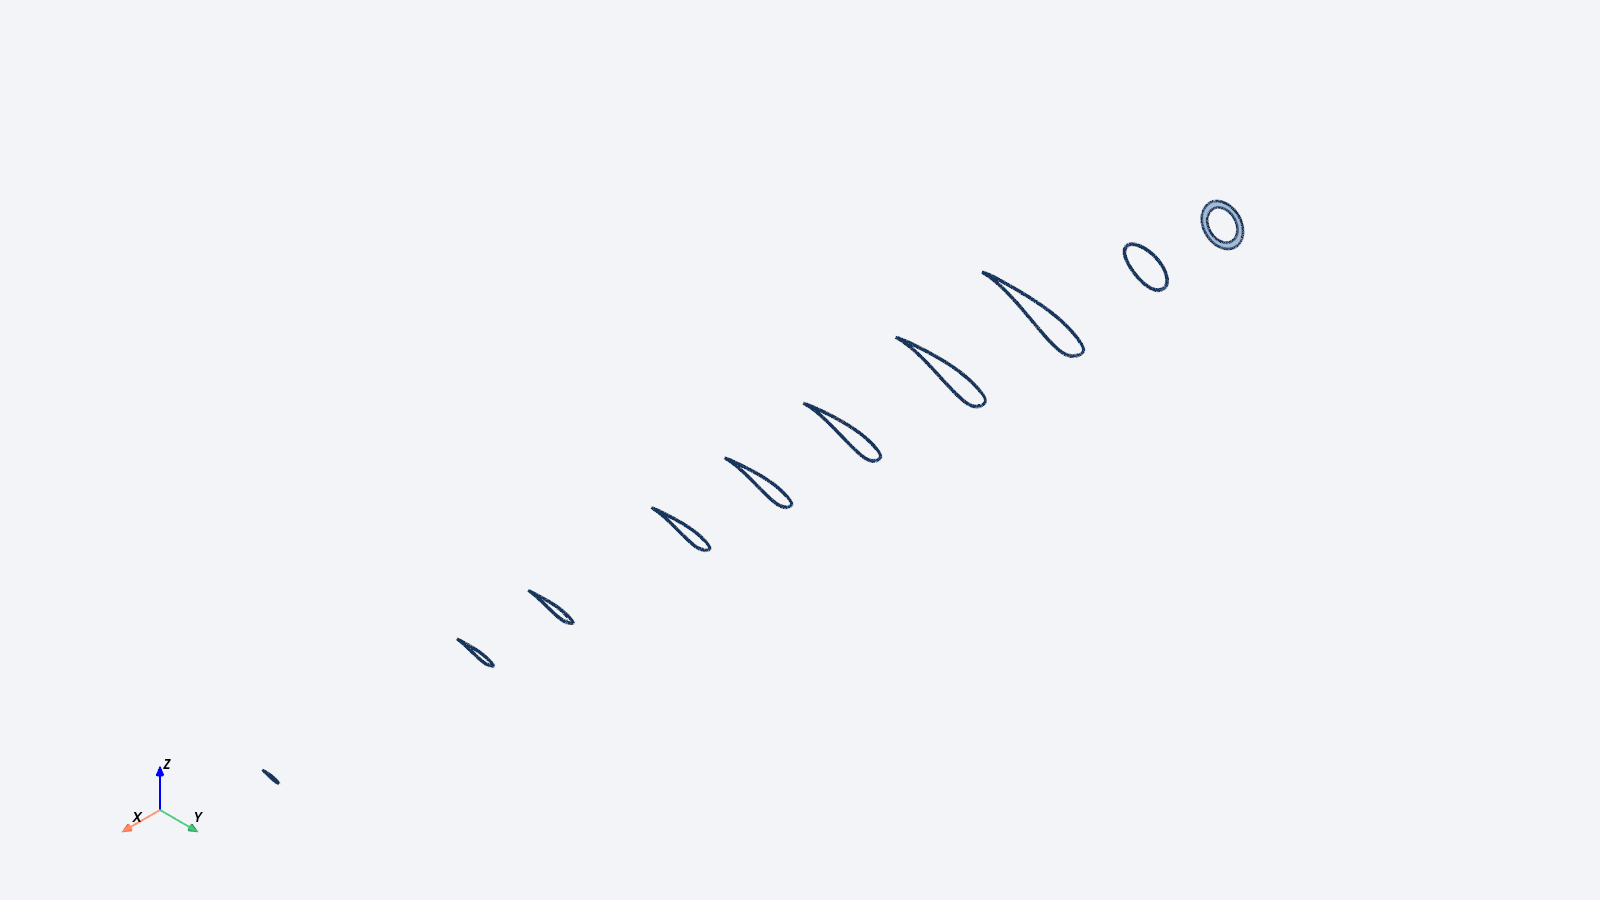
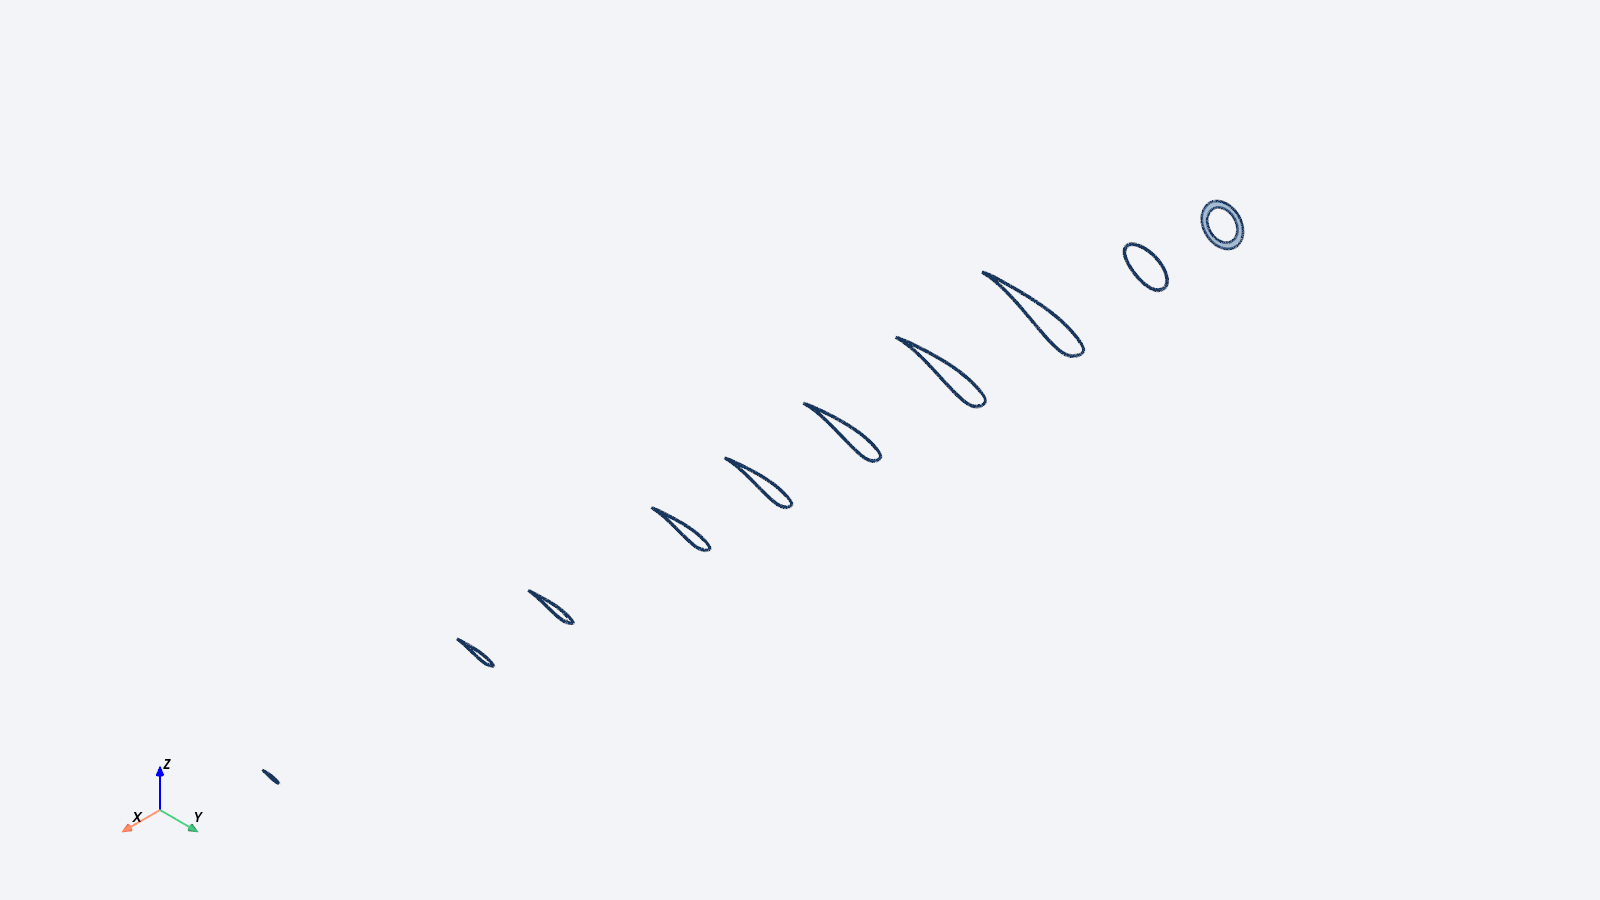
blade_3d.png shows every cross-section placed at its spanwise station.
uv run python examples/plot_css/run.py
uv run python examples/plot_css/run_plot_3d.py
File List#
run_plot_3d.py: Main Python script
blade.csv: Blade cross-section layout file
blade_3d.png: Generated PyVista screenshot
cs/: Directory of per-section VABS inputs and results