Plot Cross-Section with Beam Properties#
Problem Description#
This example demonstrates how to visualize a VABS cross-section geometry with beam properties overlay using SGIO.
Solution#
"""Example: Plot Cross-Section with Beam Properties
This example demonstrates how to:
1. Read a VABS cross-section input file
2. Read the corresponding VABS output (beam properties)
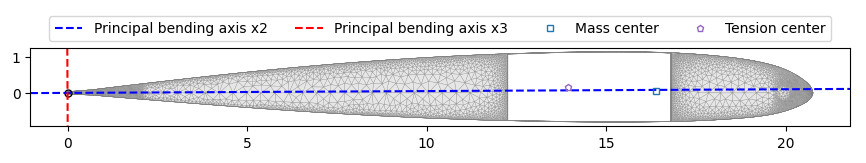
3. Visualize the cross-section with property overlay
The plot shows the cross-section geometry with beam properties like
neutral axis, shear center, and principal axes.
"""
import matplotlib.pyplot as plt
import sgio
from sgio import plot_sg_2d, plot_model_2d, plot_matrix, plot_matrix_bar3d
input_file = 'sg21eb_tri3_vabs40.sg'
output_file = 'sg21eb_tri3_vabs40.sg.K'
# Read VABS output (beam properties)
model = sgio.read_output_model(output_file, 'vabs', model_type='BM1')
# Read VABS input (cross-section mesh)
cs = sgio.read(input_file, 'vabs')
# Create plot
# Create figure and axis
fig, ax = plt.subplots(figsize=(10, 8))
# Plot cross-section geometry, then overlay the beam properties
plot_sg_2d(cs, ax)
plot_model_2d(model, ax)
# Add labels
ax.set_xlabel(r'$x_2$ (m)', fontsize=12)
ax.set_ylabel(r'$x_3$ (m)', fontsize=12)
ax.grid(True, alpha=0.3)
ax.set_aspect('equal')
# Display the plot
plt.tight_layout()
fig.savefig('sg21eb_tri3_vabs40.png', dpi=300)
# print("\nDisplaying plot... (close window to exit)")
# plt.show()
plt.close(fig)
# Plot stiffness matrix
stf_matrix = model.stff
fig2, ax2 = plt.subplots(figsize=(8, 6))
plot_matrix(
stf_matrix, fig=fig2, ax=ax2,
annotate=True, font_size=8, symlog=True
)
fig2.savefig('stiffness_matrix.png', dpi=300)
plt.close(fig2)
fig3 = plt.figure(figsize=(8, 6))
ax3 = fig3.add_subplot(projection='3d')
plot_matrix_bar3d(
stf_matrix, fig=fig3, ax=ax3,
symlog=True
)
fig3.savefig('stiffness_matrix_3d.png', dpi=300)
plt.close(fig3)
Result#
The script displays a matplotlib window showing the cross-section geometry with:
The mesh visualization
Neutral axis
Shear center
Principal axes
File List#
run.py: Main Python script
sg21eb_tri3_vabs40.sg: VABS cross-section input file
sg21eb_tri3_vabs40.sg.K: VABS beam properties output